This page summarizes known problems in our data. Please carefully go over the page before you use our data for your science. There may be problems that went unnoticed and if you discover a new problem, please let us know. We will continue to improve the pipeline to mitigate these problems for future data releases.
Persistent Problems Since PDR1
There are a few persistent problems from PDR1: bright galaxy shredding and underestimated flux uncertainties in convolved measurements. Refer to the known problem page for PDR1 for details.
Remaining Artifacts on Coadds
The new artifact rejection algorithm is very effective, particularly in the Wide survey in which the dither is large (approximately 1/3 of field of view). However, it is less effective in UltraDeep: the dithers are smaller (several arcmin) and optical ghosts stay roughly at the same position on the sky, making the artifact rejection based on the image differencing difficult. The figure below shows an example case in UD-COSMOS. There are a few satellite trails remaining there as well, but they are due to the enhanced background from bright star nearby (this is one of the known failure modes). Work is in progress to predict the locations of optical ghosts using the optical model of the instrument as well as to identify satellite trails using the Hoff transform. We expect that artifacts will be further reduced in future data releases.

Missing Bright Star Masks and Too Small Masks (updated on 29 August 2019)
We have changed the sky subtraction algorithm to preserve wings of bright objects. Because of this, masks around bright stars that indicated regions where photometry was unreliable (bright star masks) became too small in most cases. In addition, the masks used at the time of the processing were based on Gaia DR1, and some faint stars were missing due to striping in the Gaia coverage. There were also some bright stars that were simply missing from our catalog. The figure below shows an example.
All this has been fixed using Gaia DR2 with a more conservative mask size. The mask size for individual stars is determined by building an HSC source density map for sources (with grizy < 24 ) around every star in Gaia-DR2 brighter than G=18. We measure the source density profile in expanding radial annuli around the star to compute the median density profiles as a function of star brightness, and then calculate the radius to where the profile reached 3 sigma above the source density background. This is chosen as a compromise between mask size and number of false positive peak detections. This is performed separately for each broad-band. In the old masks, about 12% of the objects are masked, while the fraction increases to 20% in the new masks. As of this writing, these new masks are being validated. We plan to release the new masks no later than September 1st 2019.
UPDATE: The revised masks are now available at the database. See pdr2_{wide,dud}.masks table. Also, the original mask files in ds9 region format are available at the Bright Star Mask page. These revised masks are significantly larger than the previous masks, but they turn out to be slightly small for red stars. The figure below illustrates the problem; there are a large number of false detections at the edge of the stellar halo even after applying the revised masks. Work is in progress to further revise them.


Deblending Failure in Croweded Areas
Many of the issues in PDR1 have been mitigated, but not all, and the issue of poor photometry in crowded areas such as clusters of galaxies due to object blending still persists. It is now a bigger problem especially in the UD-COSMOS, which goes deep enough that crowding becomes an issue and makes the deblending even more difficult. Some objects in UltraDeep-COSMOS have much brighter CModel magnitudes compared to PDR1, but that is likely due to deblending failures. While an improved deblender algorithm is being developed (Melchior et al. 2018), the workaround for now is the same as PDR1; PSF-matched aperture photometry on the undeblended image (i.e., image prior to deblending) to give meaningful object colors. The largest target seeing in PDR1 was 1.1 arcsec and the PSF-matched photometry was not available when the original seeing was worse than that. The largest target seeing is now increased to 1.3 arcsec, which is the upper limit on the seeing constraint imposed in the data screening. All the coadds thus have better seeing and the PSF-matched photometry is always available. Several different aperture sizes are used in the measurement, but a small aperture (e.g., 1.5 arcsec) is recommended to avoid blending with nearby sources. Note that the aperture corrections assuming unresolved point sources have been applied to those aperture fluxes, allowing users to obtain meaningful colors. For extended sources, they do not give total magnitudes.
Photometry in i and i2 Combined Area
After calibrating individual CCDs, we perform a tract-wide photometric and astrometric calibration using multiple visits of the same field. We combine i and i2 data in this process. If a tract only has either the i or i2 -band, it is calibrated to i or i2 . However, if a tract has a mixture of i and i2 -band visits, a processing error caused all the visits to be calibrated to the i -band.
The nature of this problem is somewhat complex because we apply the color term for the i -band to the i2 -band data and do the multi-visit calibration. The difference between the i and i2 color terms is small, <∼ 1 % for most objects, except for red objects. We apply the color cut to avoid using late-type stars for calibration, but the photometric zero-point can be off by up to 1.5%. The net effect is that there is a small offset in the zero-point between the i2 -only region and the i + i2 combined region. If i -band data dominate over i2 , the effect is fairly small, but in regions where i2 -band data dominate, a clear zero-point offset is seen.
The left figure below showing the offset of the stellar sequence in riz relative to the Pickles (1998) library illustrates this problem. The sharp tract borders at R.A.=330 deg and Dec.=4 deg are due to combination of (1) difference between the i and i2 -bands and (2) the zero-point offset mentioned above. The right figure compares the riz stellar sequence in the i -band only, i2 -band only, and i + i2 combined regions. First, the left panel compares i and i2 -band only regions. The zero-points are calibrated correctly in both bands (the stellar sequence agrees at the blue end), but the difference in the filter transmission introduces a color difference for red stars. In the right panel, the i + i2 combined region is actually dominated by the i2 -band, but there are just a few i -band visits that overlap with this tract and the whole tract is calibrated to i . The shape of the stellar sequence is similar to the i2 -band only region as expected, but because the i -band color term is applied to the i2 -band data, there is a small zero-point offset ( ∆i = 0.015 mag). These two effects discussed here cause the sharp boundaries observed in the left figure. The r and r2 -bands have the same issue, although the effect is less severe due to the smaller bandpass difference.
There is a database table that indicates which filter a tract is calibrated to ( tract_colorterm ). There is also a database column that shows the relative fraction of i and i2 -band data that contributes to the coadd of each object ( filterfraction ). Users should refer to these tables and treat the filters separately for applications that require accurate photometry or for objects with exotic colors. For further analysis, the effective transmission curves discussed in Section 4.5 of the data release paper will be very useful. We may be able to provide a color term to translate i2 into i (and vice versa) for each object to put them on a common photometric system in a future release.


Over-subtracted Scattered Light in the y-band
Due to the way the y-band scattered light subtraction algorithm is implemented in the pipeline, we have mistakenly applied the subtraction to data taken after the hardware fix, in which no scattered light is observed. This resulted in the oversubtracted sky with a spatial pattern same as the scattered light as shown in the figure below. Only a small fraction of the y-band data suffered from this error and the affected regions are not full-color regions (i.e., the regions are not yet observed in all the filters). We thus do not expect it to be a major issue, but users looking only at the y-band data should be aware. Affected tracts are:
9087, 9088, 9089, 9090, 9091, 9092, 9330, 9331, 9332, 9333, 9334, 9335, 9573, 9574, 9575, 9576, 9577, 9578, 9815, 9816, 9817, 9818, 9819, 9820, 10043, 10044, 10285, 10286

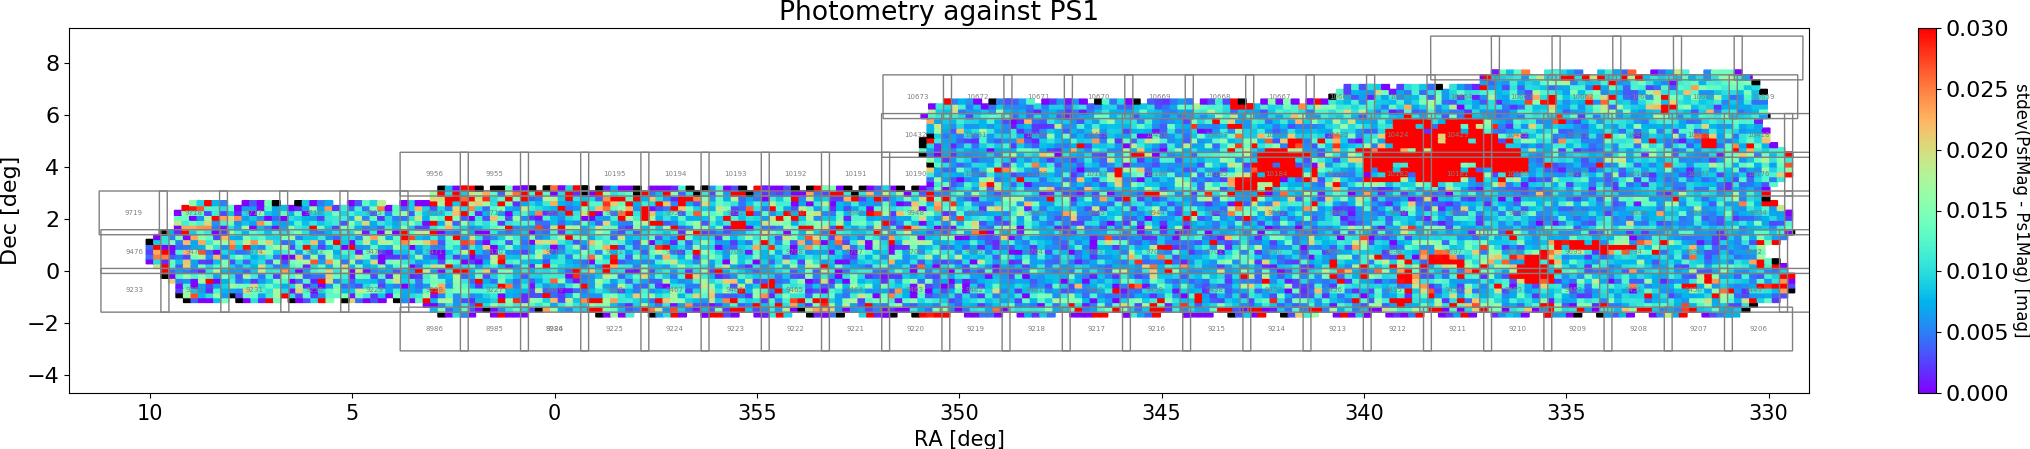
Inconsistent PSF fluxes between HSC and PS1
Our photometric accuracy is good to ∼ 1 %. However, there are regions where we observe a large scatter in the PSF photometry between HSC and PS1. Figure below shows an example, where we see extended regions with systematic errors larger than 0.05 magnitudes. We observe a similar scatter map when we compare with SDSS (see the QA page) and thus it is likely an issue with the HSC photometry. The stellar sequence scatter seems to follow the same spatial pattern but with a smaller scatter.
It turns out that this is due to artifact rejection. There are 5 visits around the bad photometry area and one of them has 1.1 arcsec seeing, while the rest have ∼ 0.6 arcsec seeing. A fraction of bright stars are clipped by the artifact rejection algorithm in the bad seeing visit and that makes the coadd PSF incorrect; the image itself is based on the 4 good seeing visits, while the PSF model is constructed using all the 5 visits (the coadd PSF does not know which visit is clipped). This inconsistency introduced the photometry offset. We have designed the artifact rejection algorithm so that we do not clip real sources. We are tracking down why a small fraction of bright stars are actually clipped. We will give updates when we have more to report.
Zero Fluxes without Flags in CModel
A small fraction of all the objects ( ∼ 1 %) have zero CModel fluxes with uncertainty NaN. This is likely a measurement failure, but the measurement flags and pixel flags are set to false and users cannot screen them with the flags. This issue is being tracked down. Users should filter out objects with CModel fluxes exactly zero or uncertainty NaN in order not to be affected by the issue.
Possible Background Residual
Because we subtract the sky background on a relatively large scale, there may be a low-level sky residual on a small scale. A preliminary investigation seems to show a filter-dependent sky residual at a ∼ 29 mag / arcsec^2 level. Most sources are not affected by this level of sky residual, but users interested in extended, low-surface brightness galaxies may want to be careful. There is a set of useful objects in each patch called sky objects. The pipeline picks 100 random points in a patch outside of object footprints and make the blank-sky measurements, just like the measurements for real objects. These sky objects are useful for measuring background fluctuation and residual. The sky objects are stored in the database just like real objects and they have merge_peak_sky = True .
NEW: Bright object masks flags in forced and meas catalog for 3 patches of PDR2_Wide
For 3 patches (9226-4,6), (9712-8,8), (9954-8,0) of PDR2_Wide
– Database (pdr2_wide.forced, pdr2_wide.meas tables)
The bright object flags (“x_pixelflags_bright_objectcenter” : x=filter) are “false” for all the objects.
– FITS catalog file (forced_src-*.fits, meas-*.fits, ref-*.fits in pdr2_wide survey)
The bright object flags (“base_PixelFlags_flag_bright_objectCenter”) are “false” for all the objects.
If you use new mask flags in mask table (“pdr2_wide.masks.x_mask_pdr2_bright_objectcenter”) released in 2020-01-30, this problem has been fixed.
Until 2020-01-30, there was inconsistency between database catalog tables (“forced” & “meas”) and fits catalog files (“forced_src-*.fits”, “meas-*.fits”, “ref-*.fits”), for these 3 patches.
– Database (“pdr2_wide.forced”, “pdr2_wide.meas” tables):
NO BRIGHT OBJECT MASK has been applied in the pipeline reduction, therefore “x_pixelflags_bright_objectcenter” flags of all the objects in “forced” and “meas” table are set as false. This situation is as same as current.
– FITS catalog file (forced_src-*.fits, meas-*.fits, ref-*.fits):
Bright star object mask is applied in the pipeline reduction, but objects are NOT FULLY DEBLENDED, i.e. the number of objects in 9226-4,6 patch was 21241, while database told 23619. These catalog files were replaced to ones which coincident with database records.
NEW: Photometric zero-point offset in NB387
It is likely that the photometric zero-point of the NB387 data is off by a large amount. Investigations are still underway, but comparisons with spectroscopic data from SDSS suggests that there is an ~0.45mag offset (still a tentative number). Users using the NB387 photometry should be warned. We suspect the offset is due to metallicity effects. We apply color-terms to the PS1 photometry to infer NB387 photometry in the zero-point calibration, and the color-terms are derived for solar metallicity stars. However, stars we actually use for calibrations are relatively faint (g~20) and they are likely metal poor halo stars. For now, we recommend applying a magnitude offset to the NB387 photometry stored in the database as mag_NB387 = mag_NB387_database – 0.45. For those using the coadd images, add -0.45 mag to the zero-point (i.e., 26.55).
