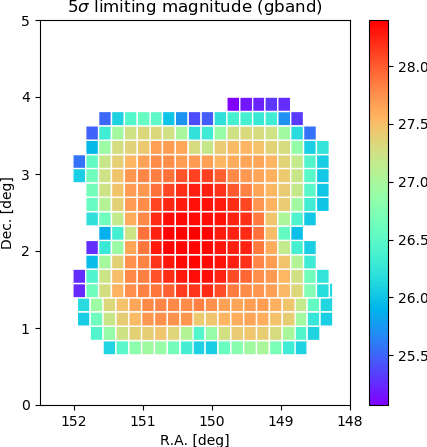
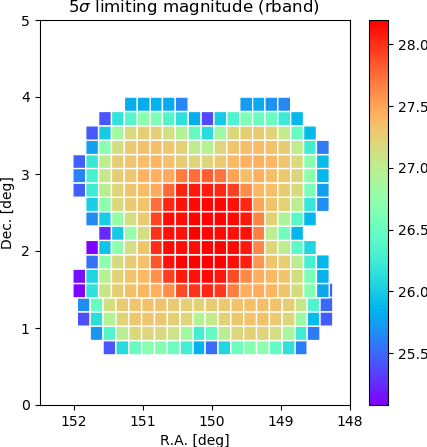
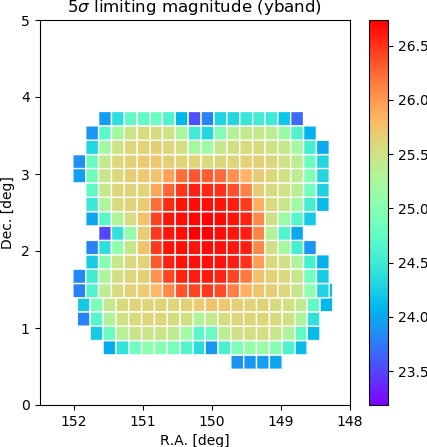
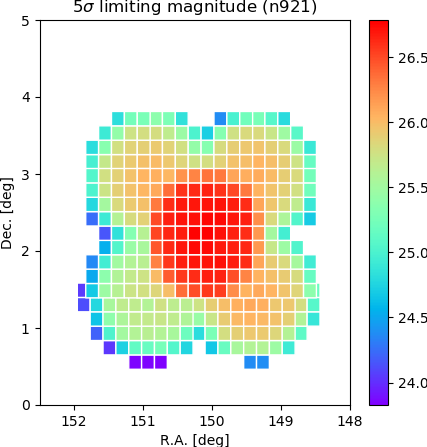
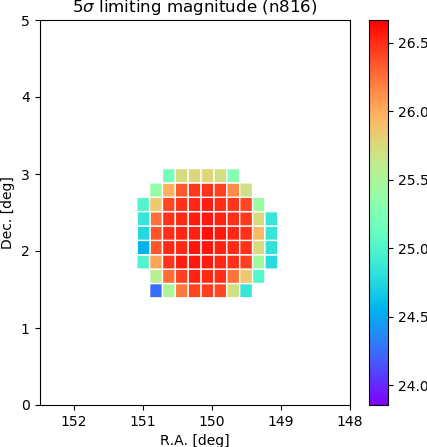
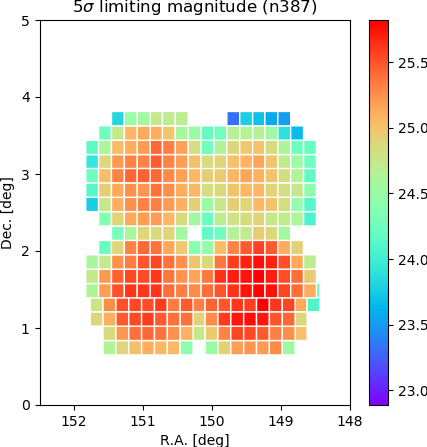
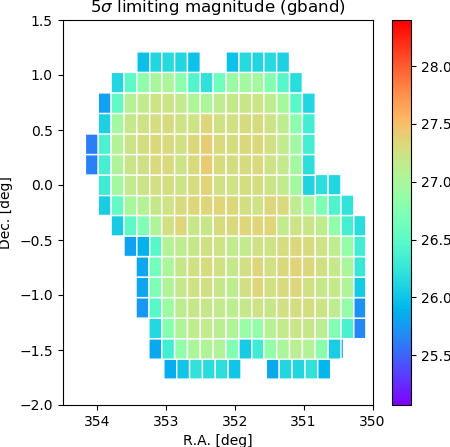
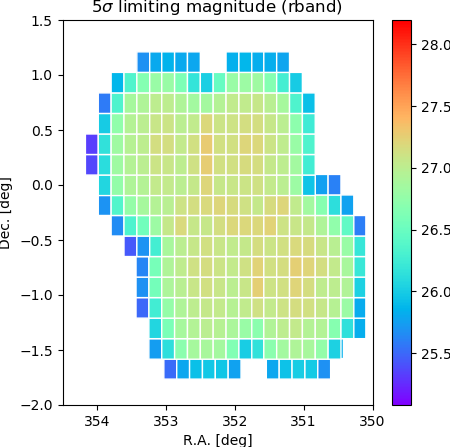
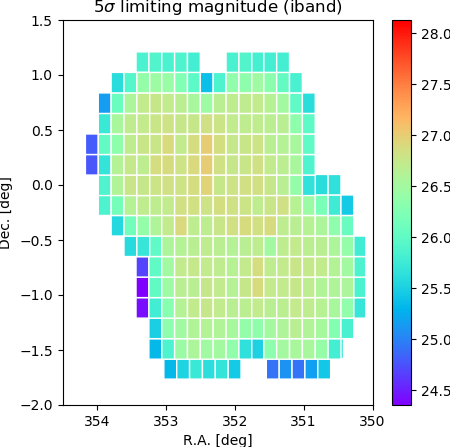
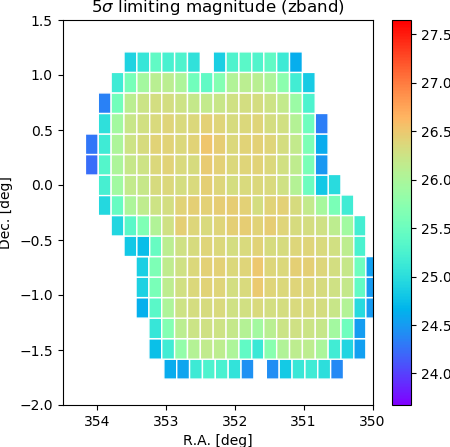
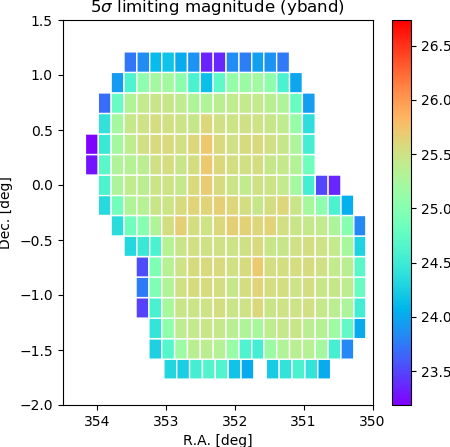
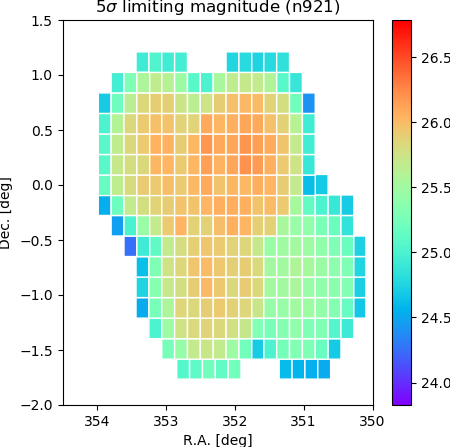
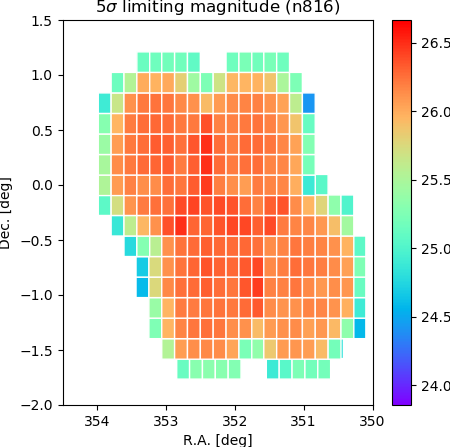
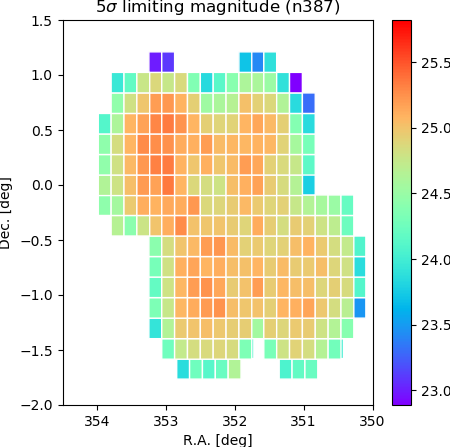
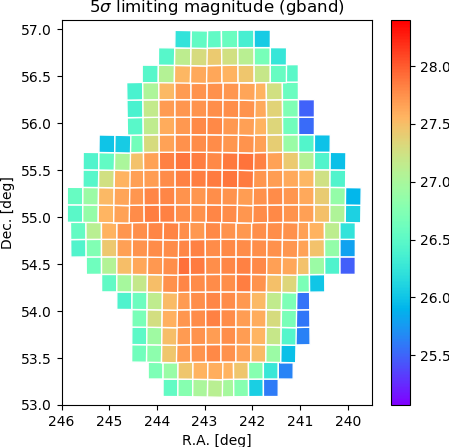
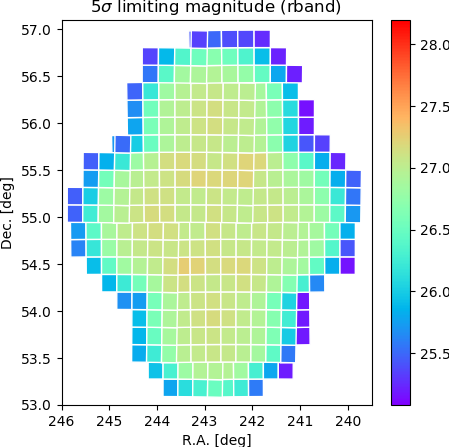
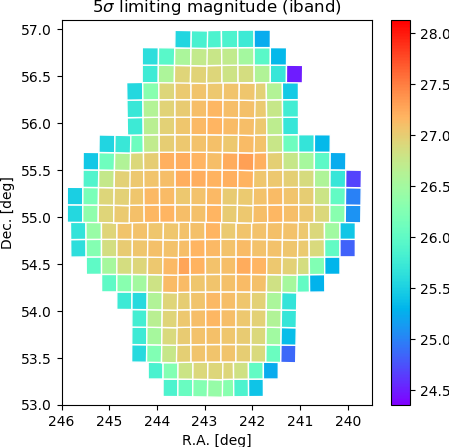
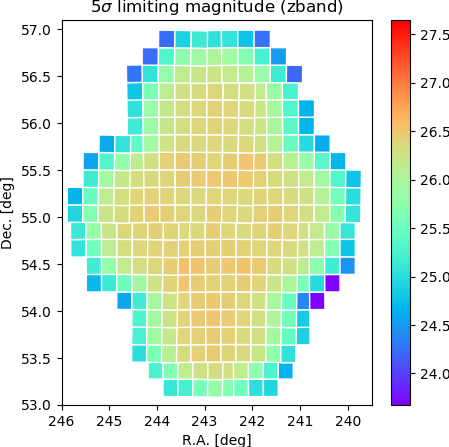
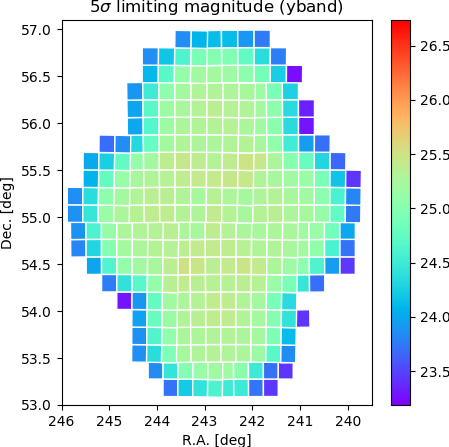
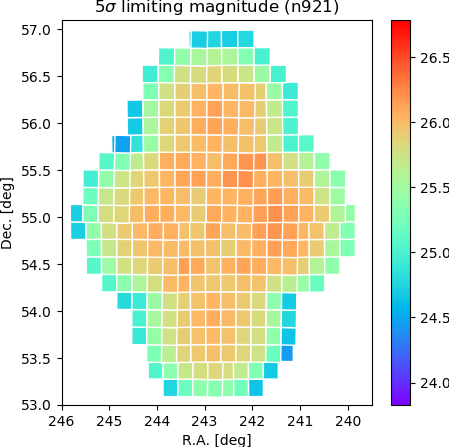
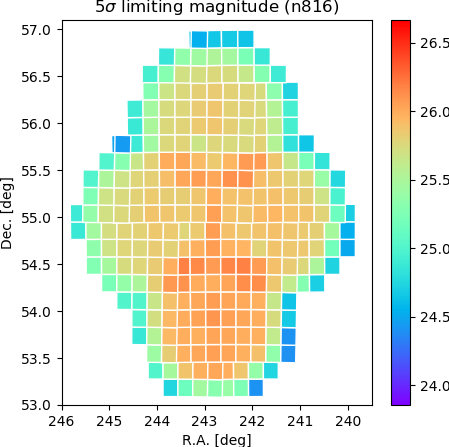
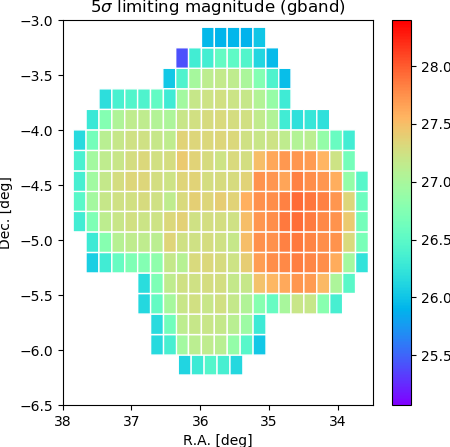
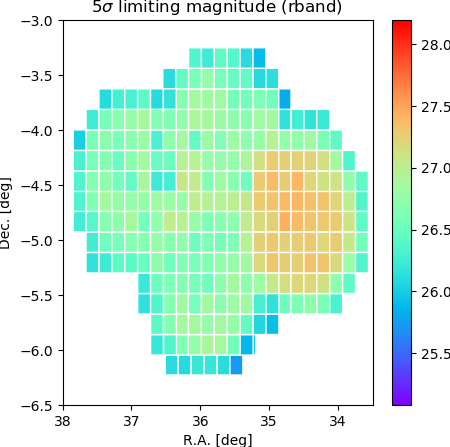
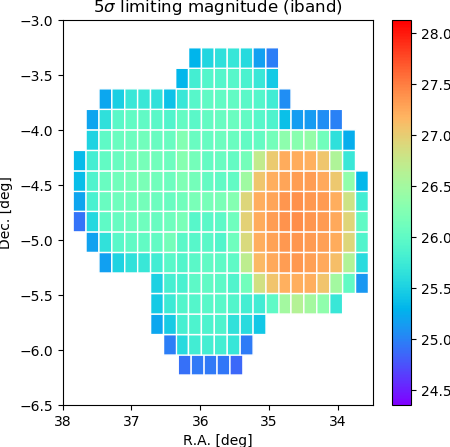
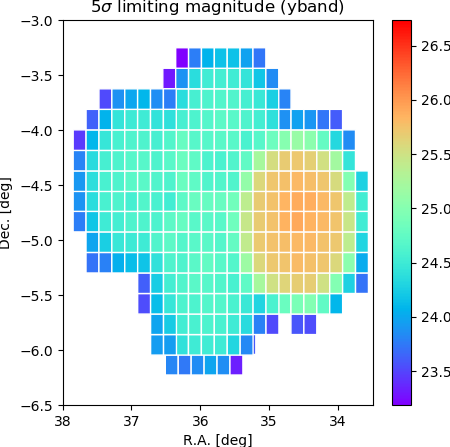
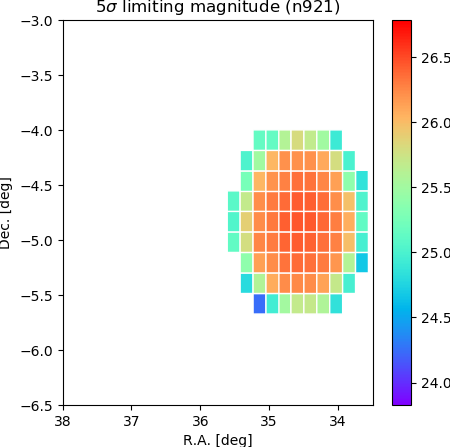
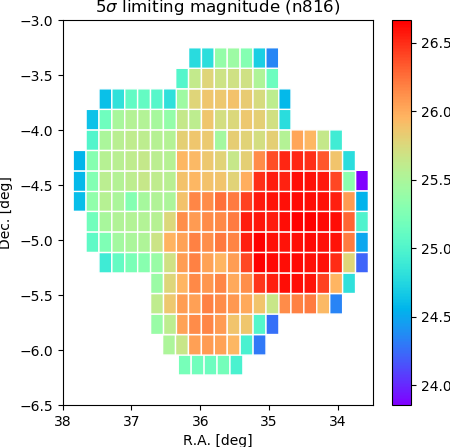
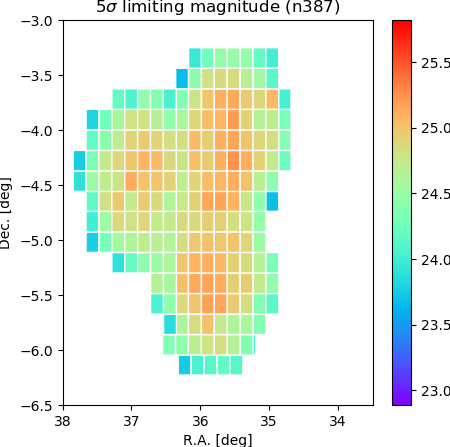
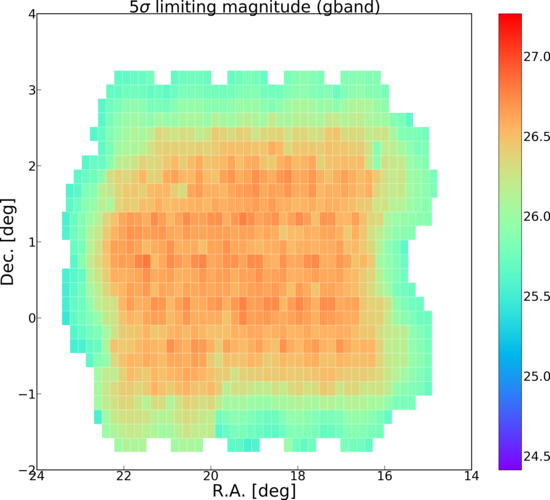
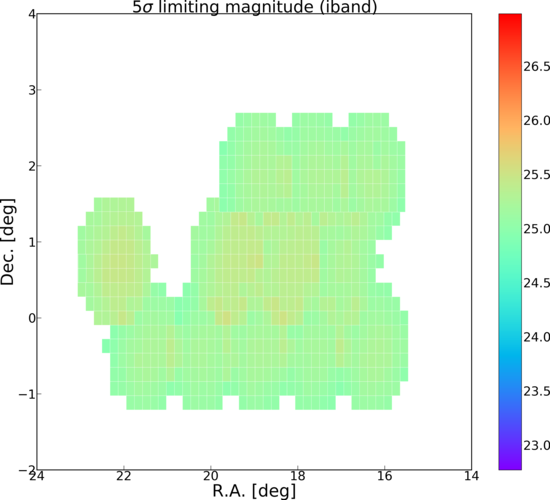
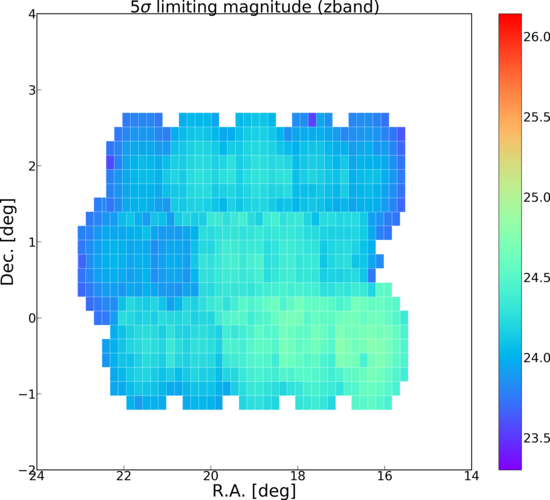
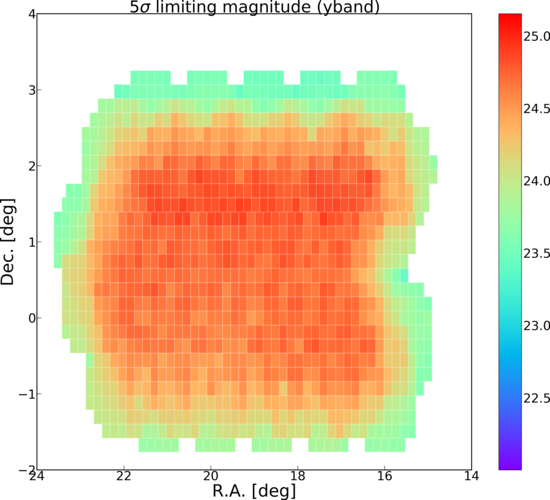
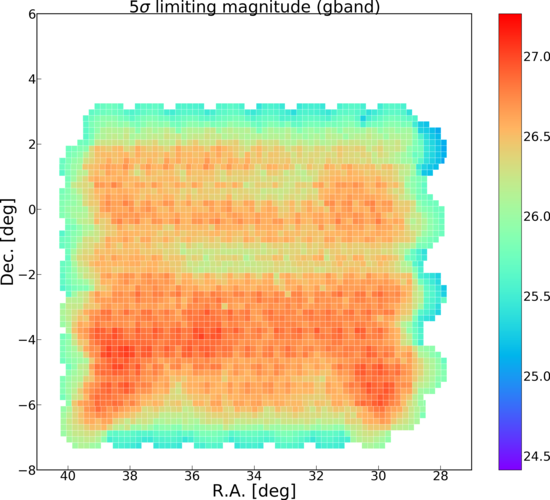
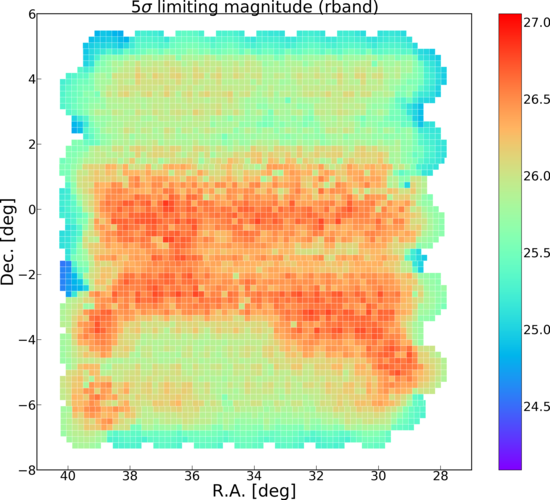
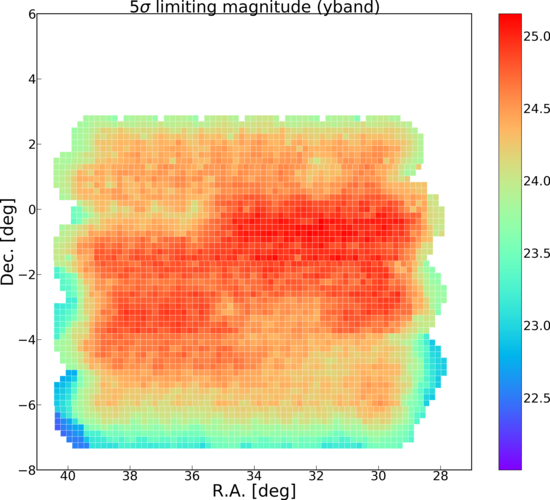
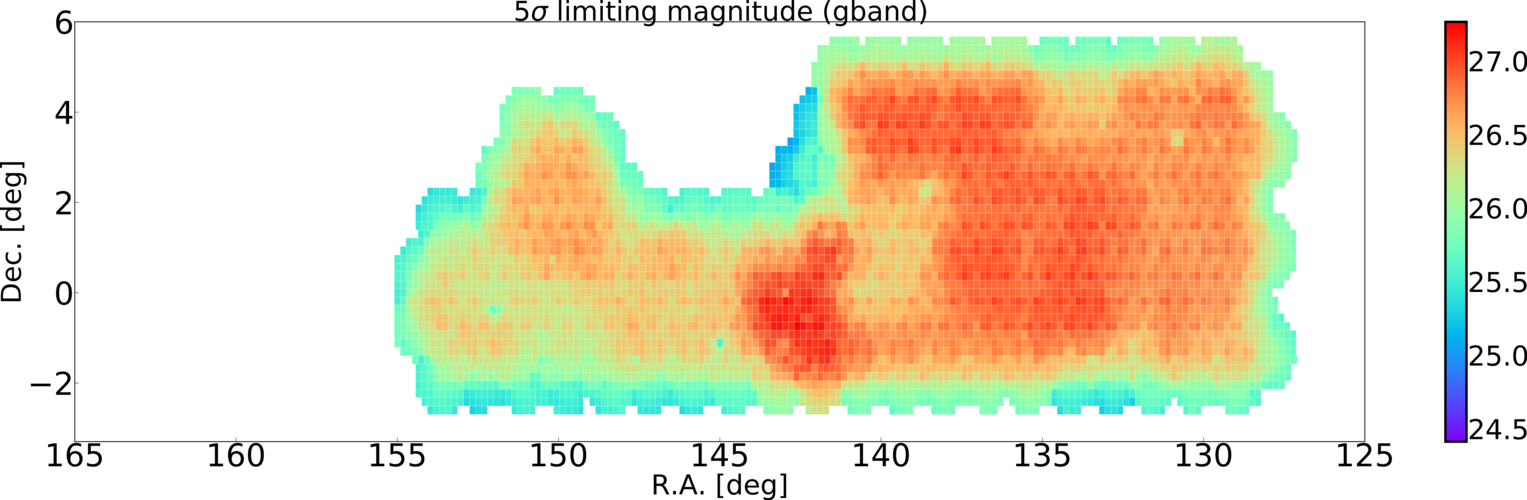
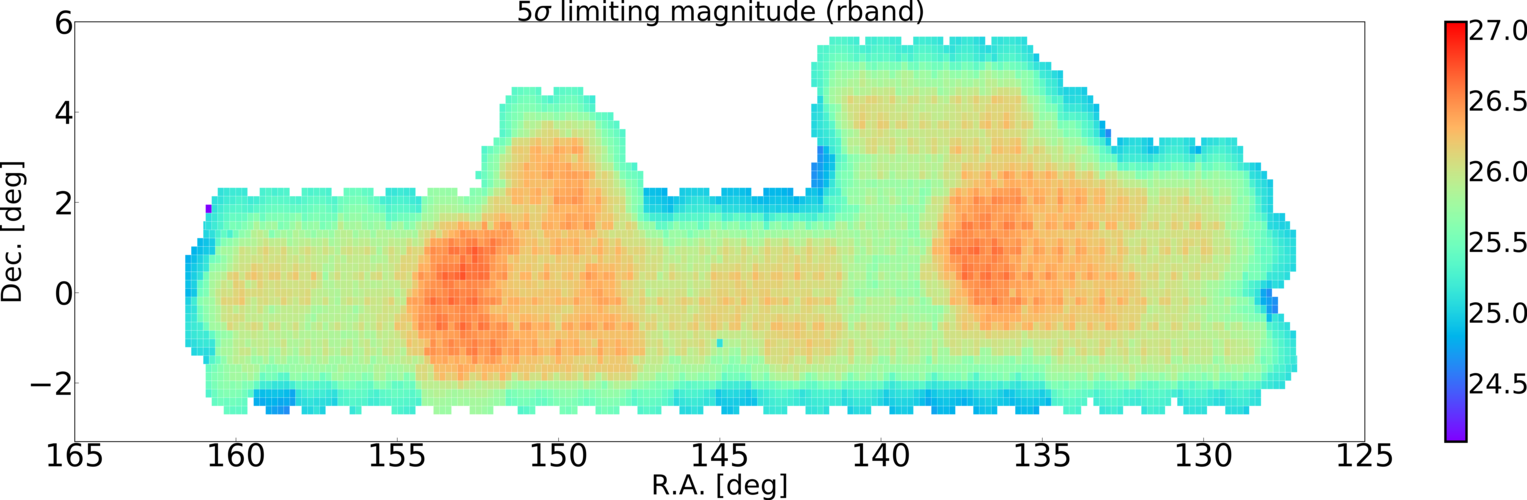
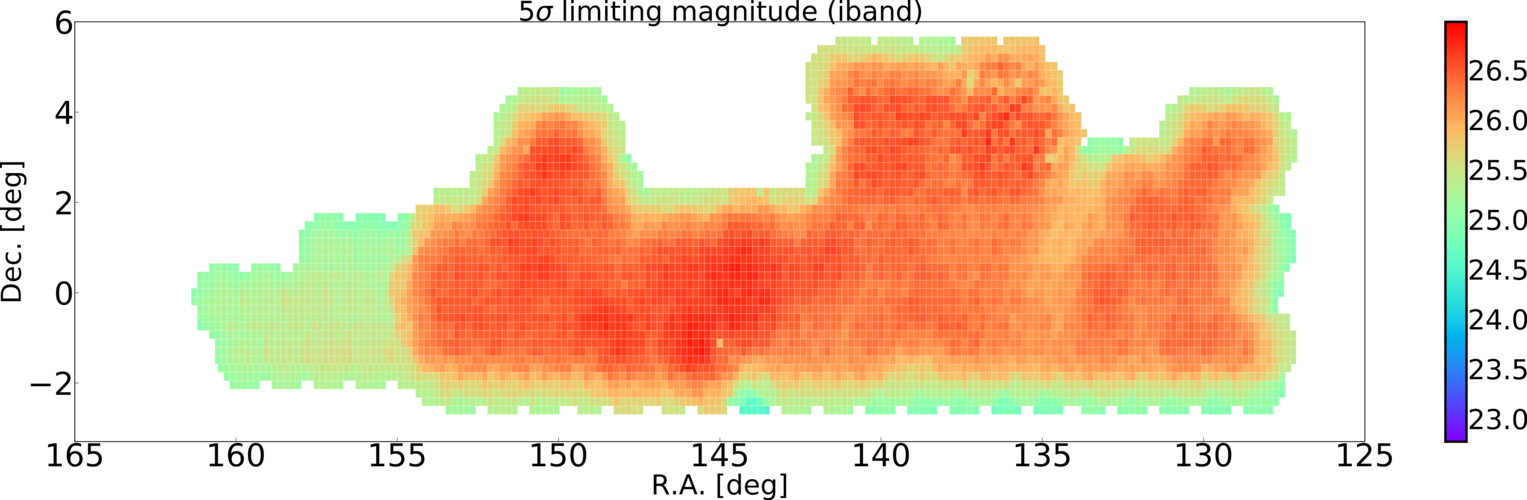
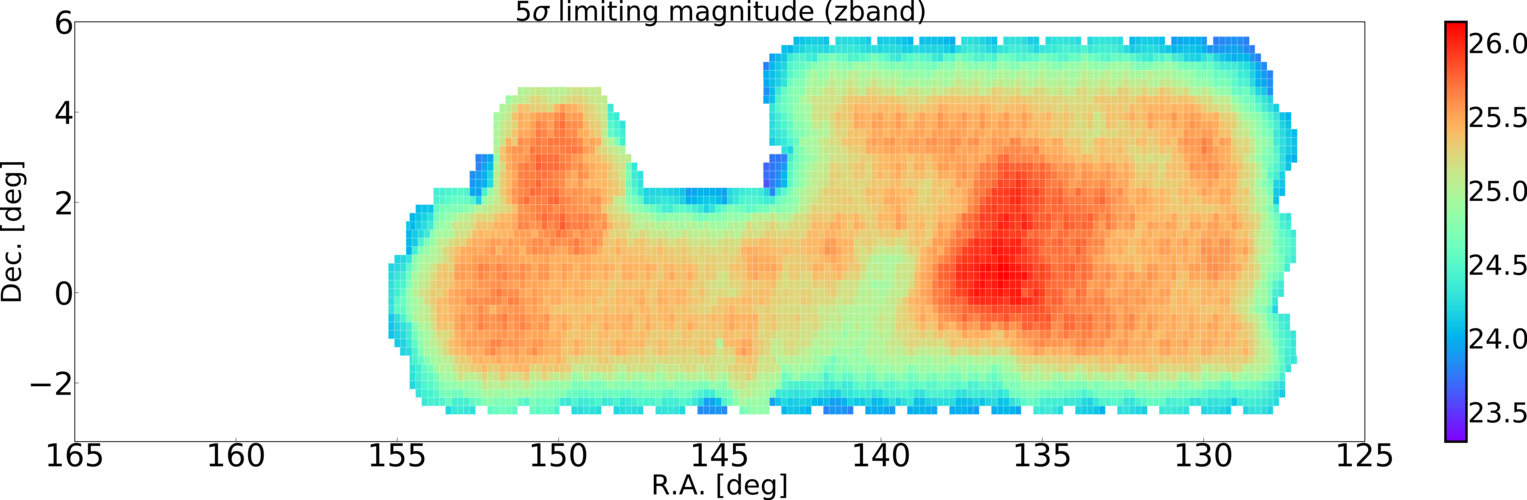
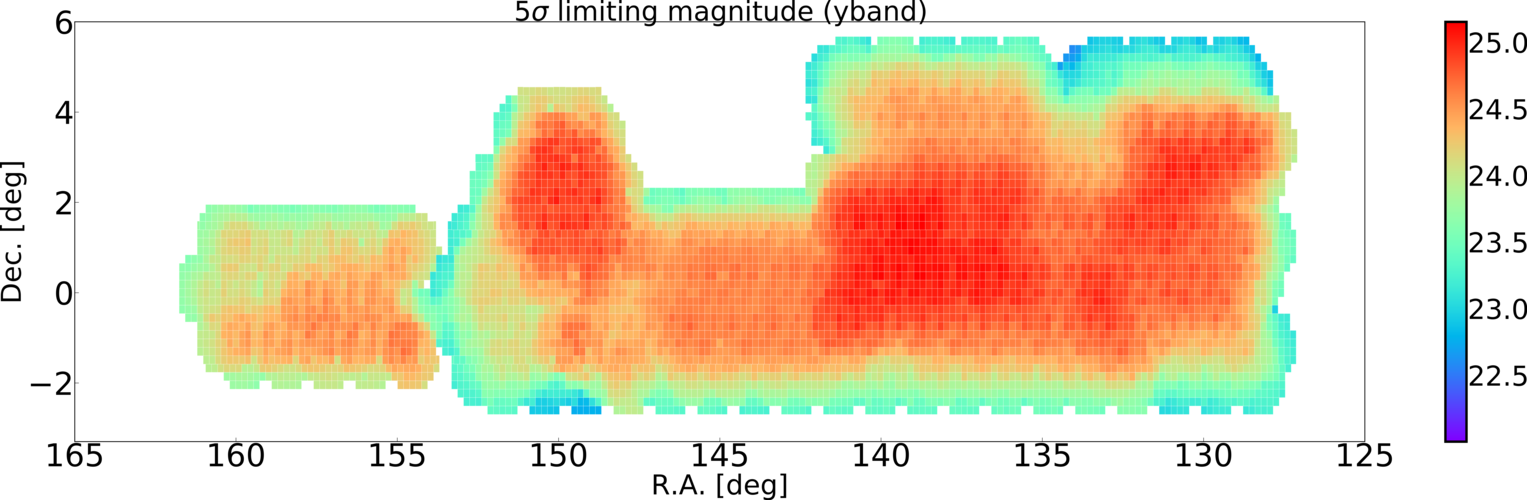
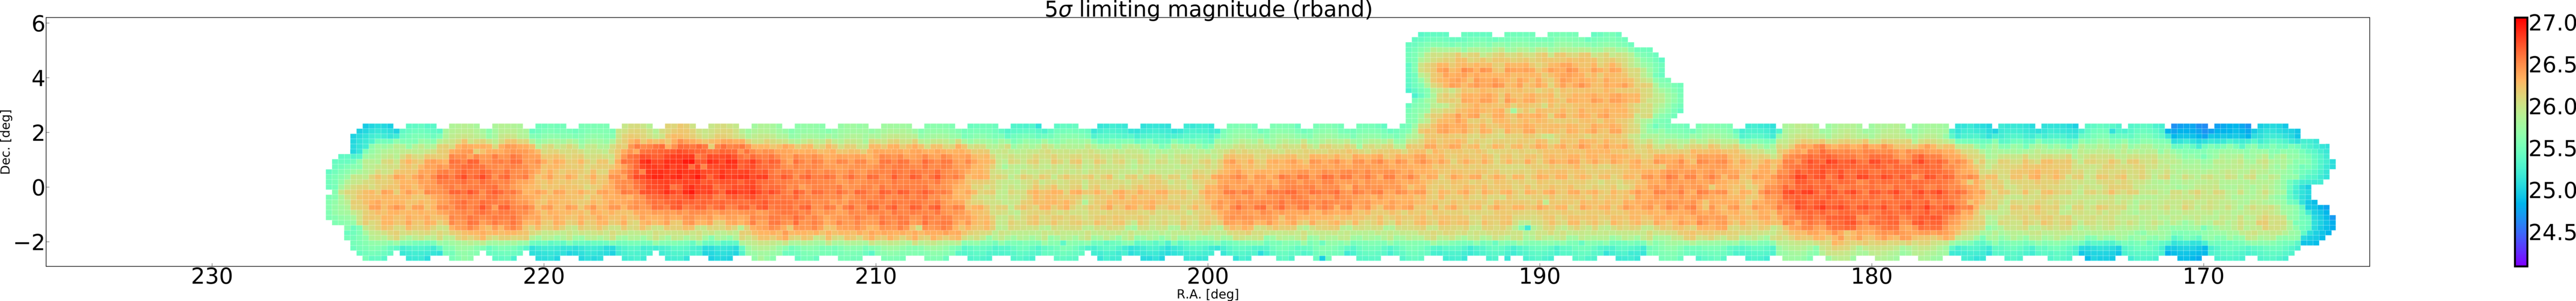
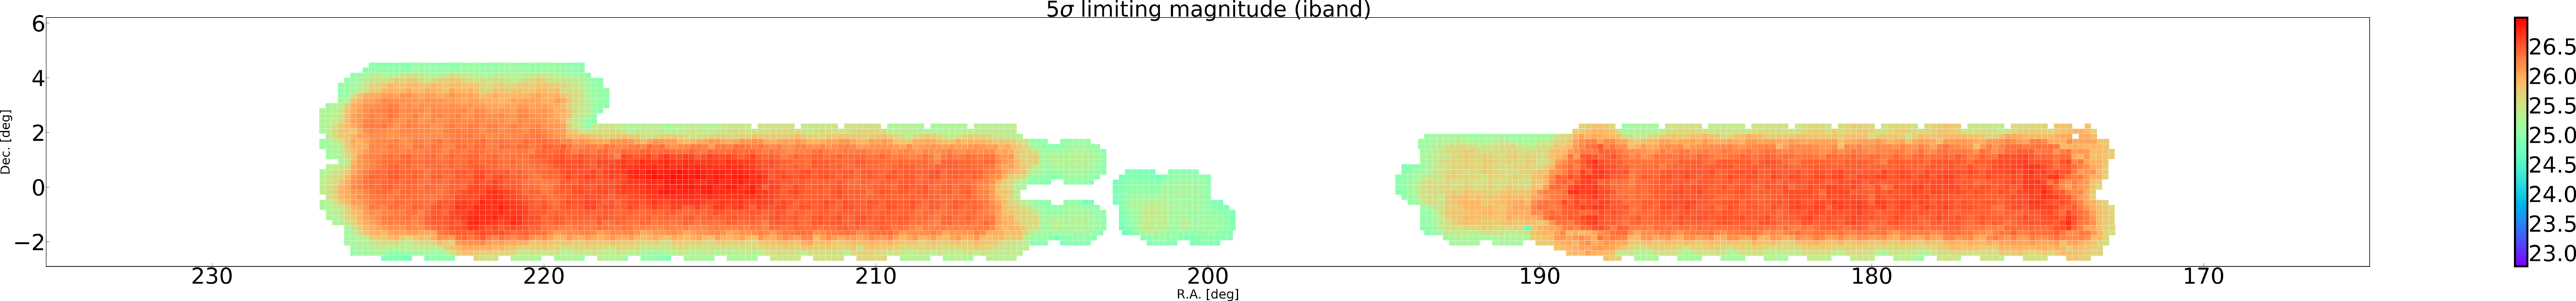
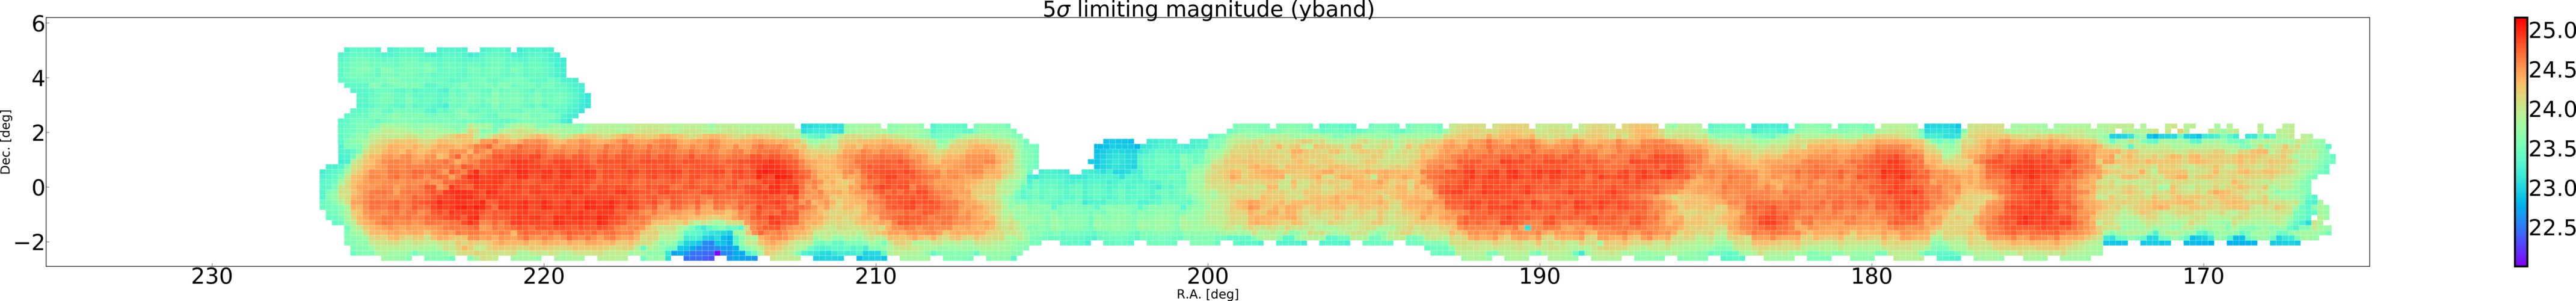
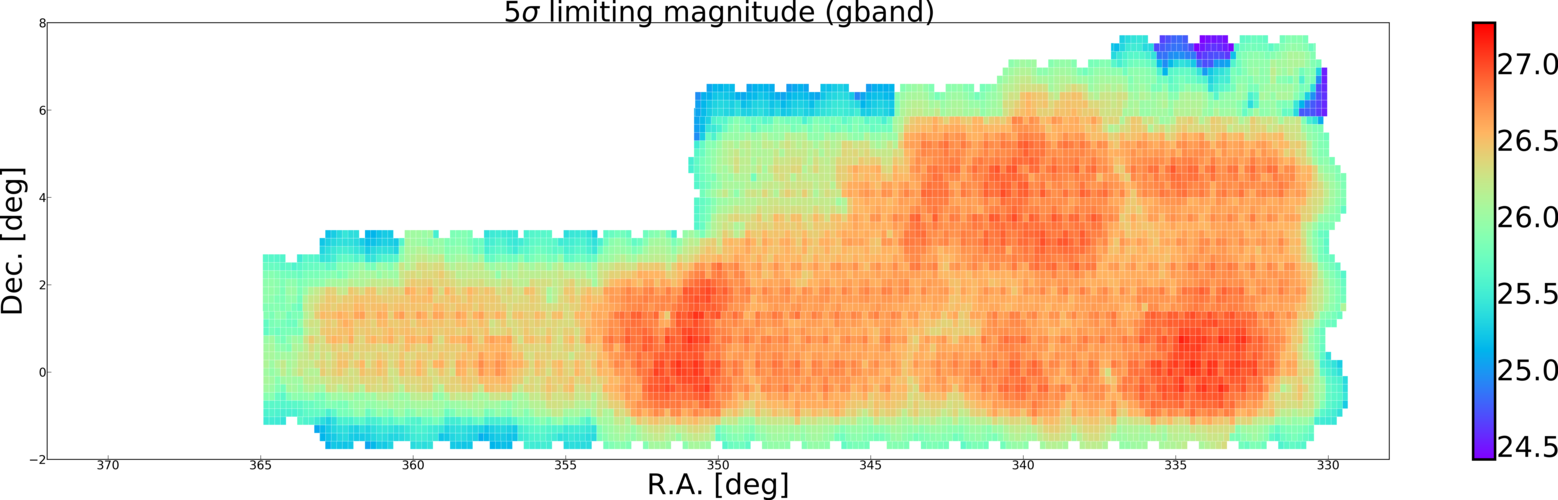
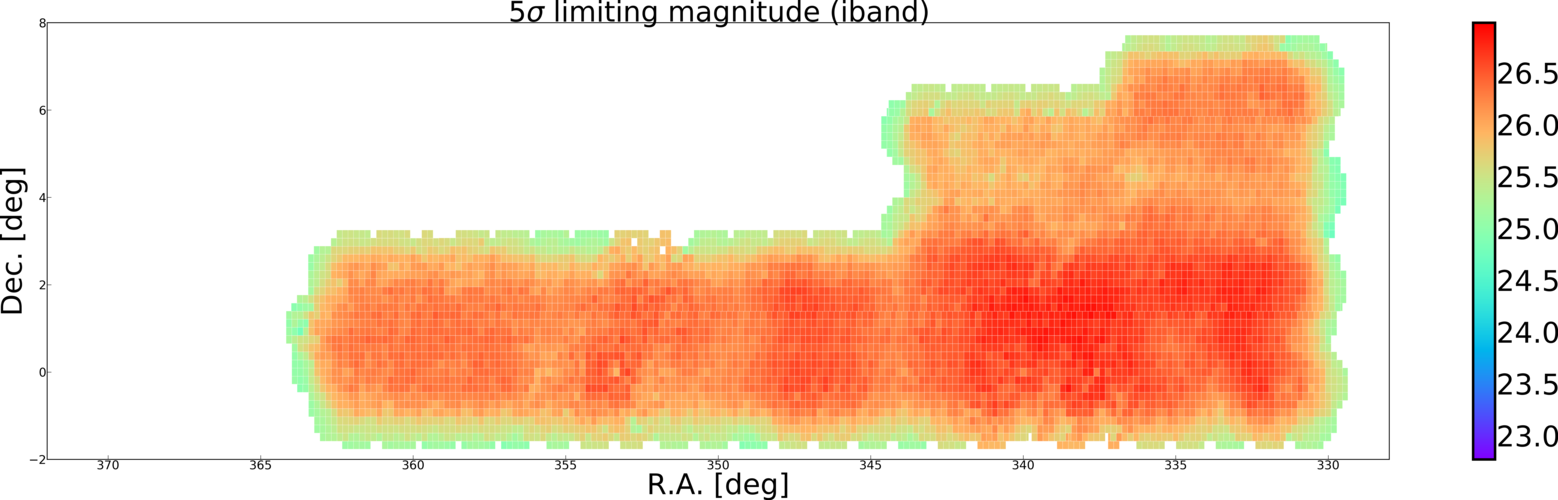
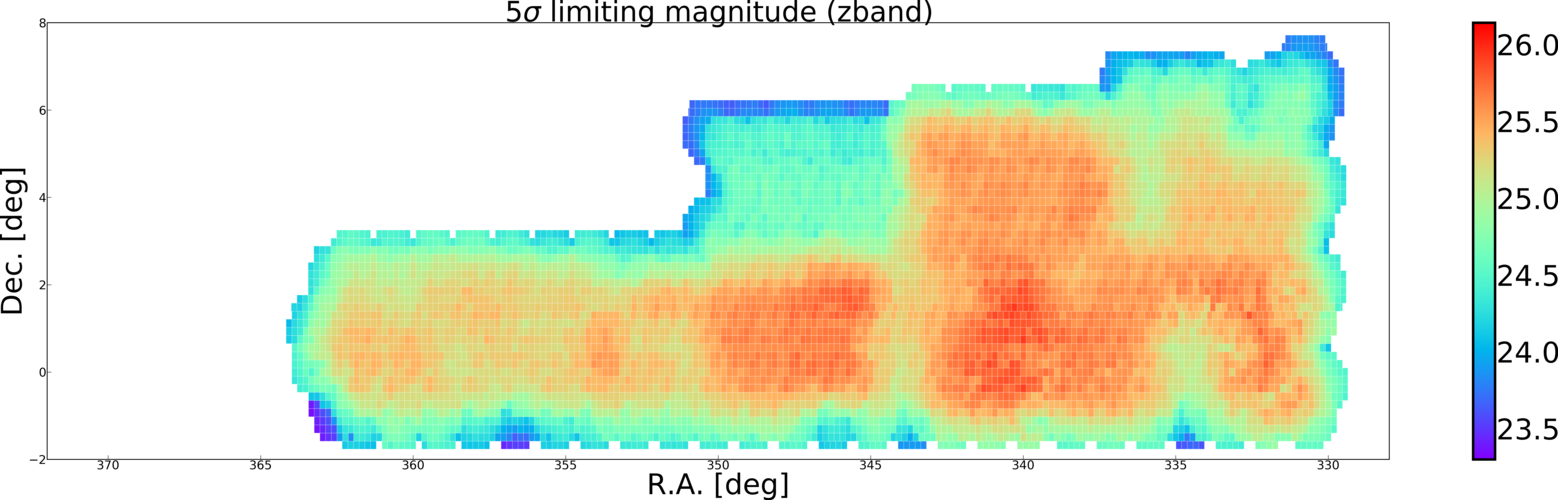
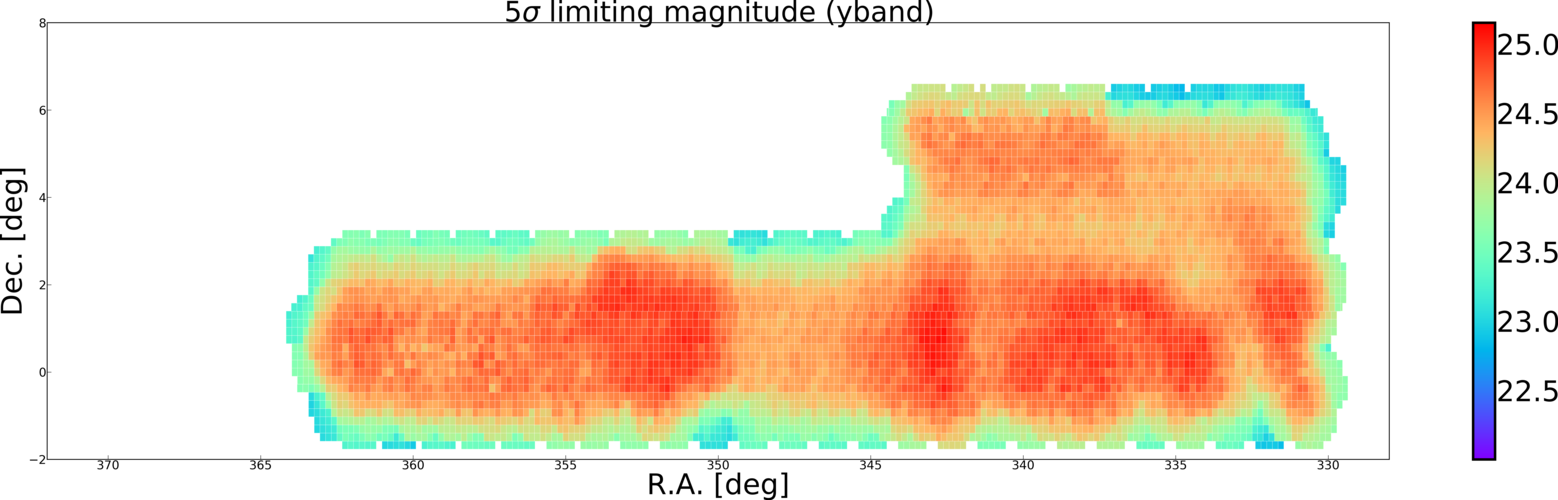
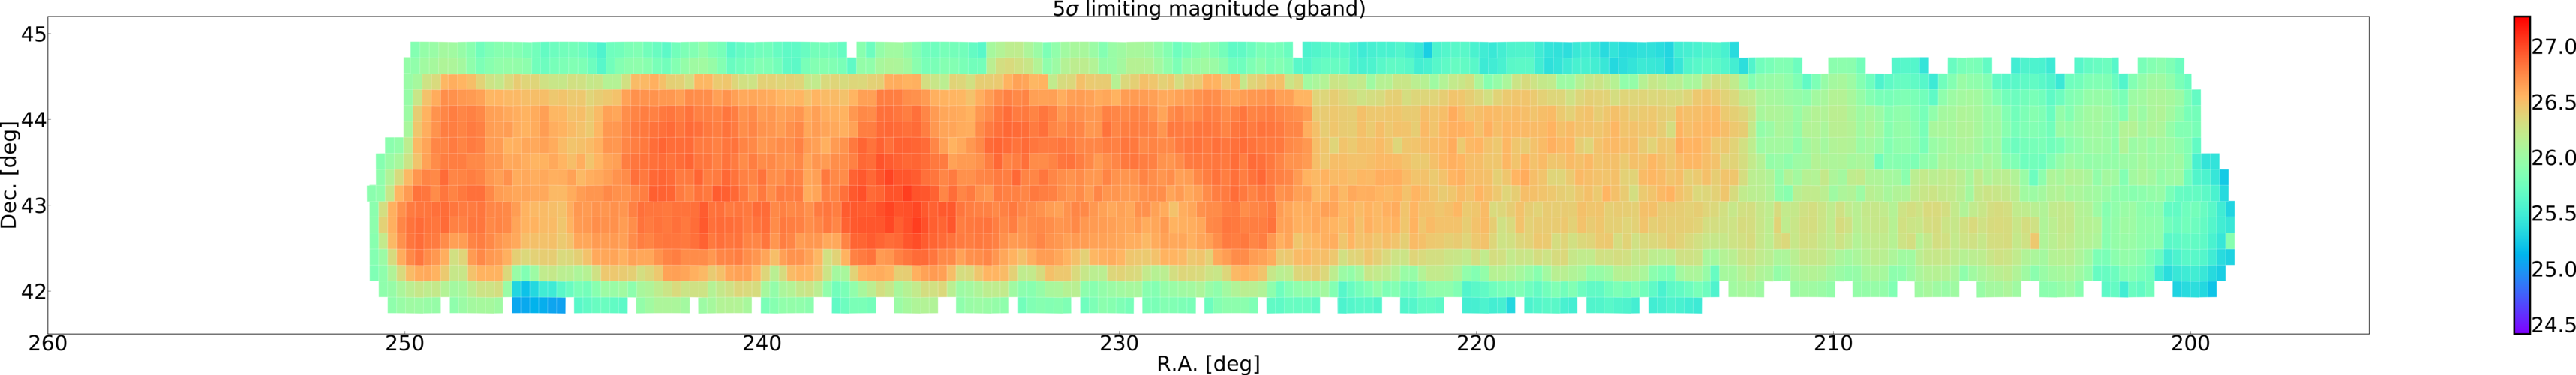
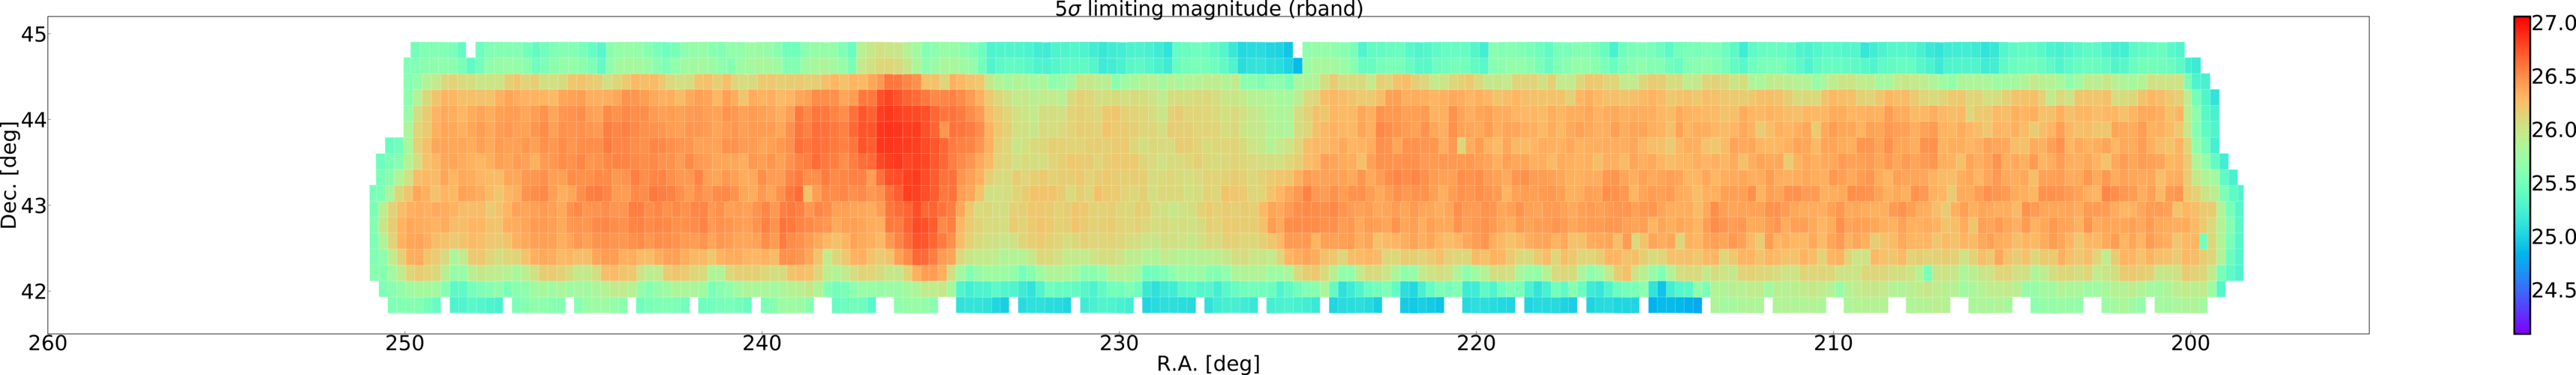
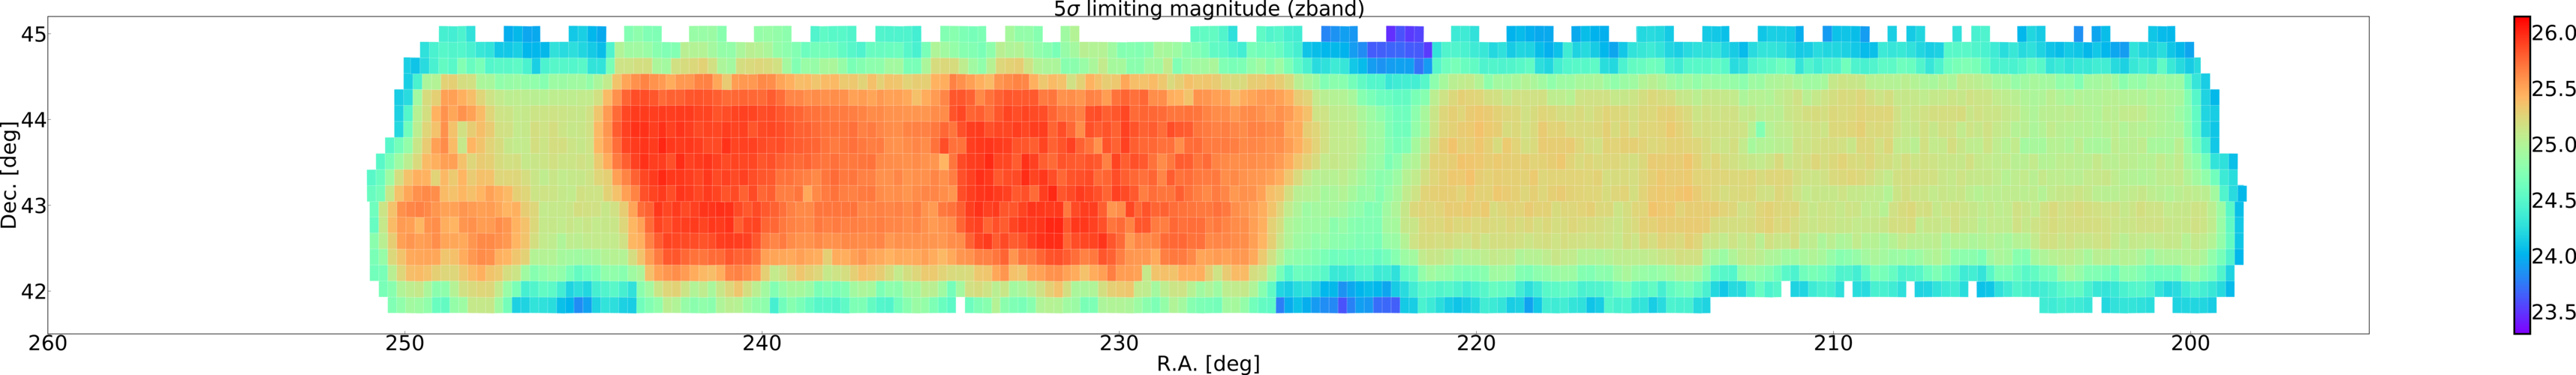
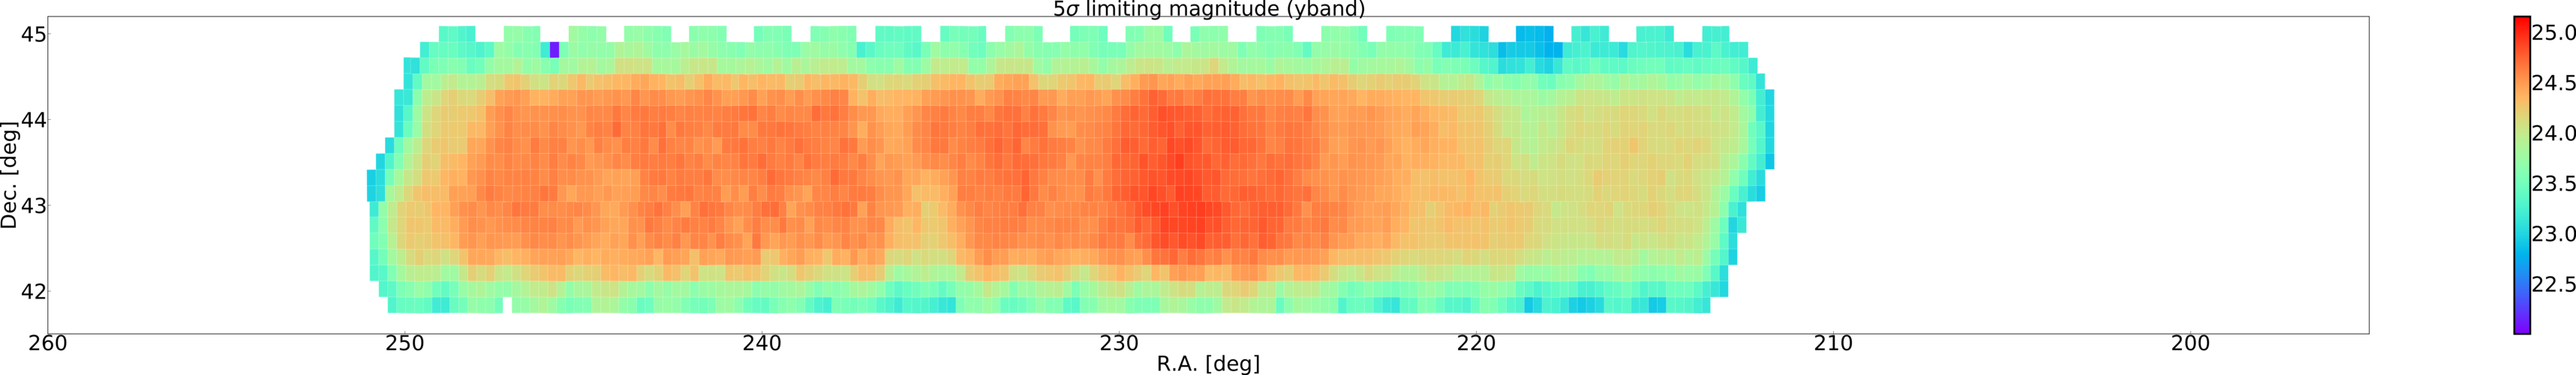
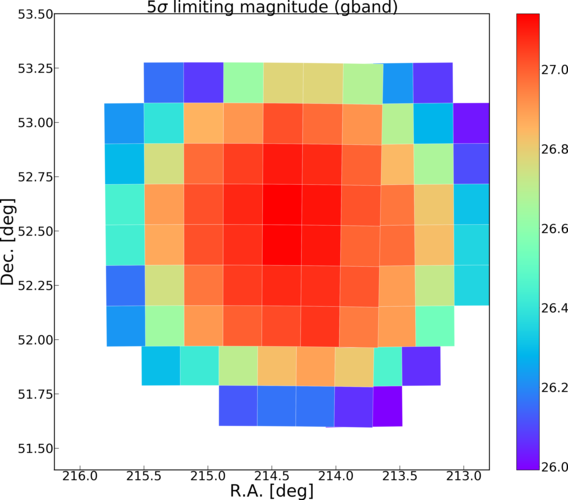
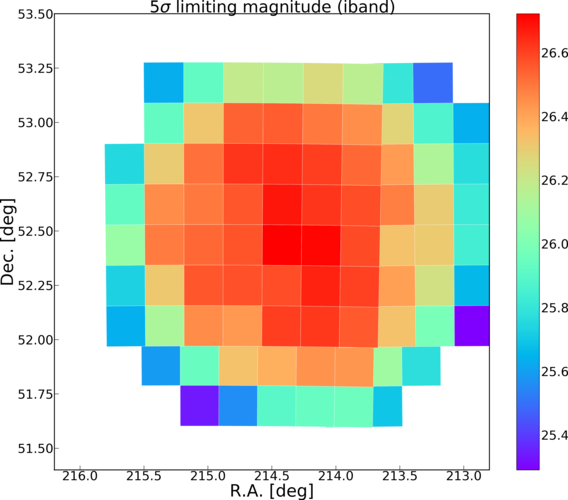
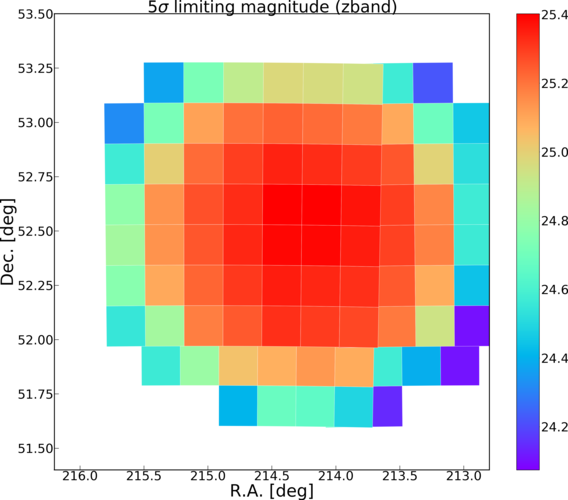
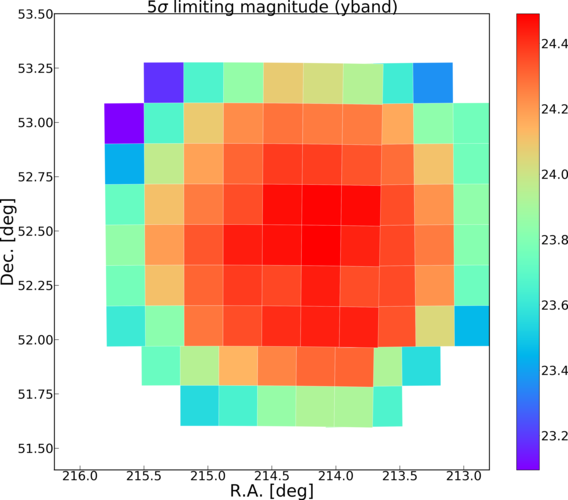
The figures below show approximate 5sigma limiting magnitudes for point sources for each of the survey fields. The limiting magnitudes are estimated using the PSF flux uncertainties as quoted by the pipeline, which tend to be underestimated due to the covariances between the pixels. The limiting magnitudes here may be somewhat optimistic. Each square represents a patch.
Deep & UltraDeep
| Field Name | HSC-g | HSC-r | HSC-i | HSC-z | HSC-Y | NB0921 | NB0816 | NB0387 |
|---|---|---|---|---|---|---|---|---|
| COSMOS |
|
|

|

|
|
|
|
|
| DEEP2-3 |
|
|
|
|
|
|
|
|
| ELAIS-N1 |
|
|
|
|
|
|
|
|
| SXDS+XMM-LSS |
|
|
|

|
|
|
|
|
Wide
| Field Name | HSC-g | HSC-r | HSC-i | HSC-z | HSC-Y |
|---|---|---|---|---|---|
| W01 (WIDE01H) |
|

|
|
|
|
| W02 (XMM) |
|
|

|

|
|
| W03 (GAMA09H) |
|
|
|
|
|
| W04 (WIDE12H+GAMA15H) |

|
|
|

|
|
| W05 (VVDS) |
|

|
|
|
|
| W06 (HECTOMAP) |
|
|

|
|
|
| W07 (AEGIS) |
|

|
|
|
|